
"You have to realize that every document landing in your inbox costs money."
That's how a project manager at a renewable energy project office put it. And he's right - except at this company, it's not about a few invoices. It's about roughly 700 incoming documents per month, distributed across 281 active renewable energy projects.
The company operates primarily photovoltaic plants, plus wind and biogas projects. 140 customers, growing. The problem: with every new project, the document flood rises - invoices, credit notes, cost assessments, fee notices, change notifications, interest certificates. Annualized, that's around 8,000 documents, trending sharply upward.
The Core Problem: When 2% of Suppliers Cause Half the Work
The real surprise was the Pareto effect: eleven energy utilities - just two percent of all suppliers - generated roughly half of all documents. And these documents were the hardest to process: kWh tables, redispatch lines, direct marketing settlements. Each utility with its own format, its own document numbers, its own period conventions.
The starting point was classic: documents arrived via email, portals, and occasionally by mail. Manual extraction, analysis, and cost-center assignment across this volume and diversity was simply no longer feasible.
Meanwhile, there was no systematic view of expected vs. received documents per project and month. When documents didn't arrive or came late, gaps were noticed only during reconciliation or in accounting. Month-end close became slow, granular, and error-prone.
Many operational and technical evaluations? Simply not possible.
 Figure: The diversity of document types - from credit notes through monthly invoices to redispatch settlements
The Solution: One Central System Instead of Scattered Spreadsheets
The guiding principle was radically simple: capture everything cleanly, centrally, and consistently. A single digital intake was defined - regardless of whether documents arrive by email, portal, or mail - everything lands in the same import stream and is automatically ingested, named, read, categorized, validated, exported, and archived.
Business Rules as the Foundation
Instead of ad-hoc labeling, clear rules now apply: document numbers must be unique. Document types are defined per supplier - no synonyms, no improvised labels. Recurring services consistently carry a From/To period, down to line-item level for energy quantities. Key EVU documents are tagged with analysis-relevant attributes.
If a supplier is new or a document can't be fully extracted, a human validation step kicks in. The system runs mostly automatically - users only intervene for approvals or edge cases.
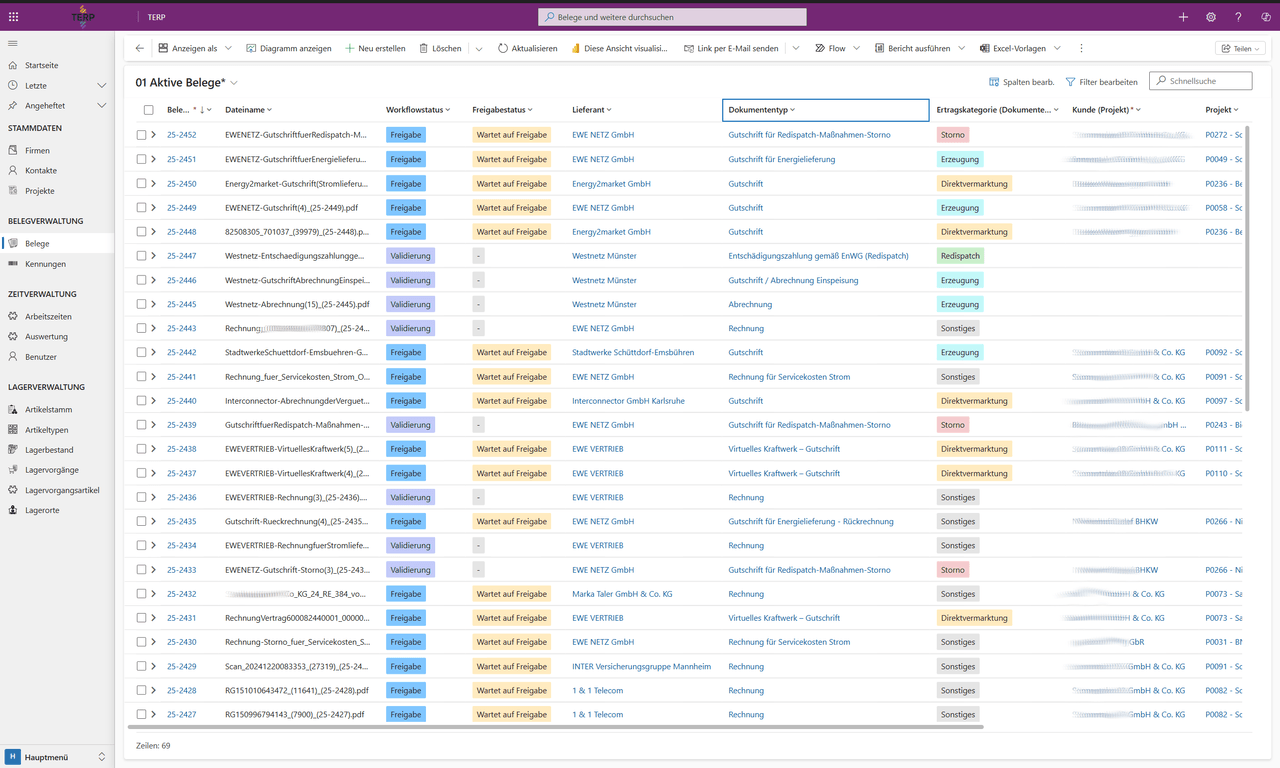 Figure: Central document overview - every document with status, document type, and project assignment
From Excel Spreadsheets to a Business App
The old Excel workbooks served as the starting point and were transformed into a performant database and responsive app (desktop, tablet, phone). The result: instead of contradictory labels, there's one source of truth - terms standardized, periods clean, versioning captures changes, document numbers are open-item safe.
The app provides three central views:
Suppliers - The complete set of document types per supplier, documents actually received, relevant identifiers, and the assigned approval team.
Projects - Expected documents (typically three per project and month), planned yields, capacity in kWp, a Teams link to the project space, and the Google Maps location.
Documents - The full status chain is transparent: from intake through classification and validation to approval - including preview, document type, revenue category, energy-quantity lines with From/To and kWh, and a complete workflow history.
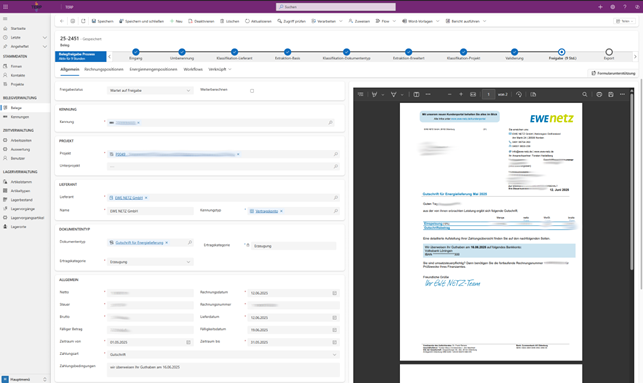 Figure: Document detail view - metadata and process status on the left, document preview on the right
Clear Accountability, Lean Processes
Responsibilities were sharpened: approvals are granted only by people explicitly assigned to the supplier or project. This eliminates ping-pong and shortens decision paths.
In parallel, commercial logic was pushed before posting: documents are pre-accounted up to DATEV handoff, including cost centers and relevant metadata. The tax advisor no longer has to pre-code - they can post immediately. The close phase becomes calmer.
Business Process Flows ensure each document only traverses the steps it needs, ensuring consistent data and traceable approvals while minimizing rework.
Reporting: Three Views That Were Previously Impossible
1. The Missing-Document Matrix
Per project, up to three expected documents per month are tracked - typically generation, direct marketing, and redispatch. The Missing-Document Matrix makes these expectations visible and flags gaps unambiguously.
For users, this means: no searching, no silent gaps - instead a concrete action list, prioritized by area (PV, wind, biogas), billing mode, and time period. Proactively chasing suppliers prevents gaps from surfacing late in accounting, saving time, nerves, and money.
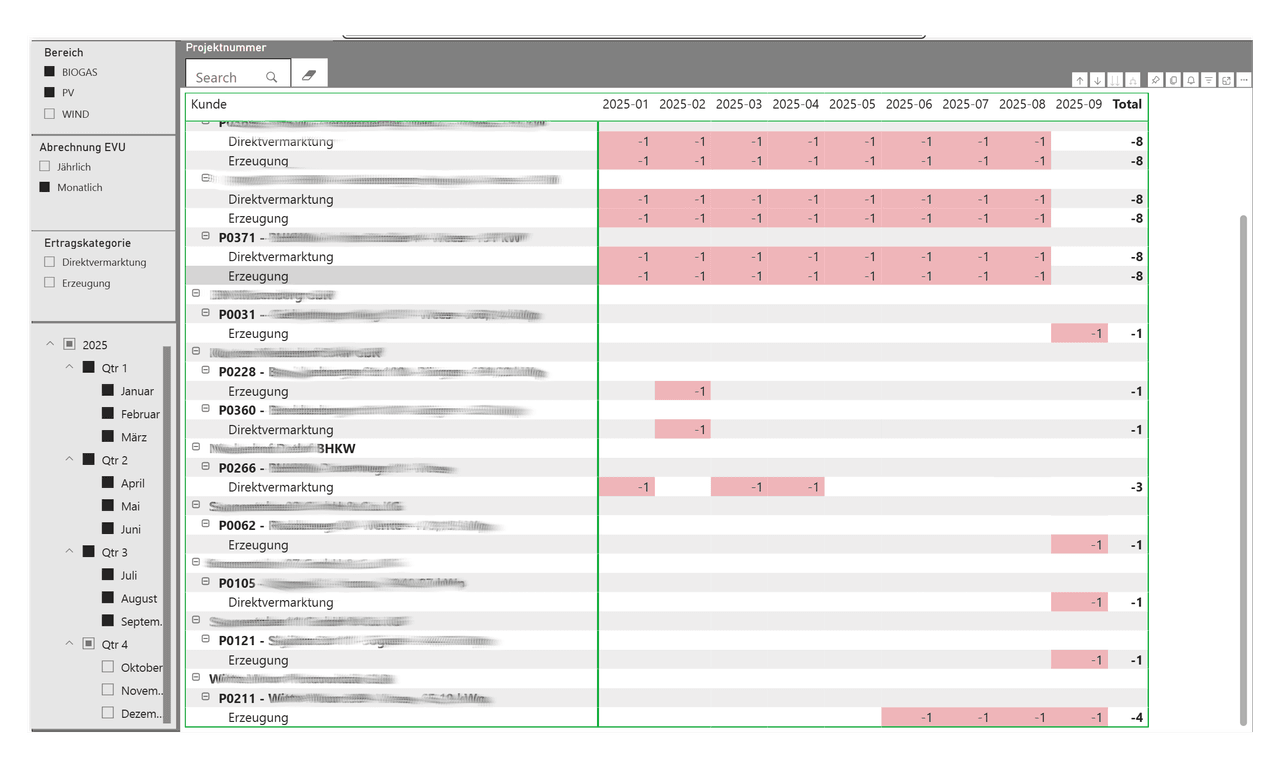 Figure: The Missing-Document Matrix - red fields indicate missing expected documents per project and month
2. Plant Performance: Technical Operations Analysis
The second view brings technical operations and commercial billing together. Month by month, plant meters and utility meters are compared side by side; percentage deltas are immediately visible and broken down by revenue logic: feed-in, direct marketing, self-consumption, redispatch.
This creates an early-warning system: Is the delta a timing issue in utility billing, planned self-consumption, a redispatch correction, or a metering error? The result is faster, fact-based decisions - verify readings on time, clarify billing terms with the utility, assess redispatch effects, adjust forecasts and planned yields.
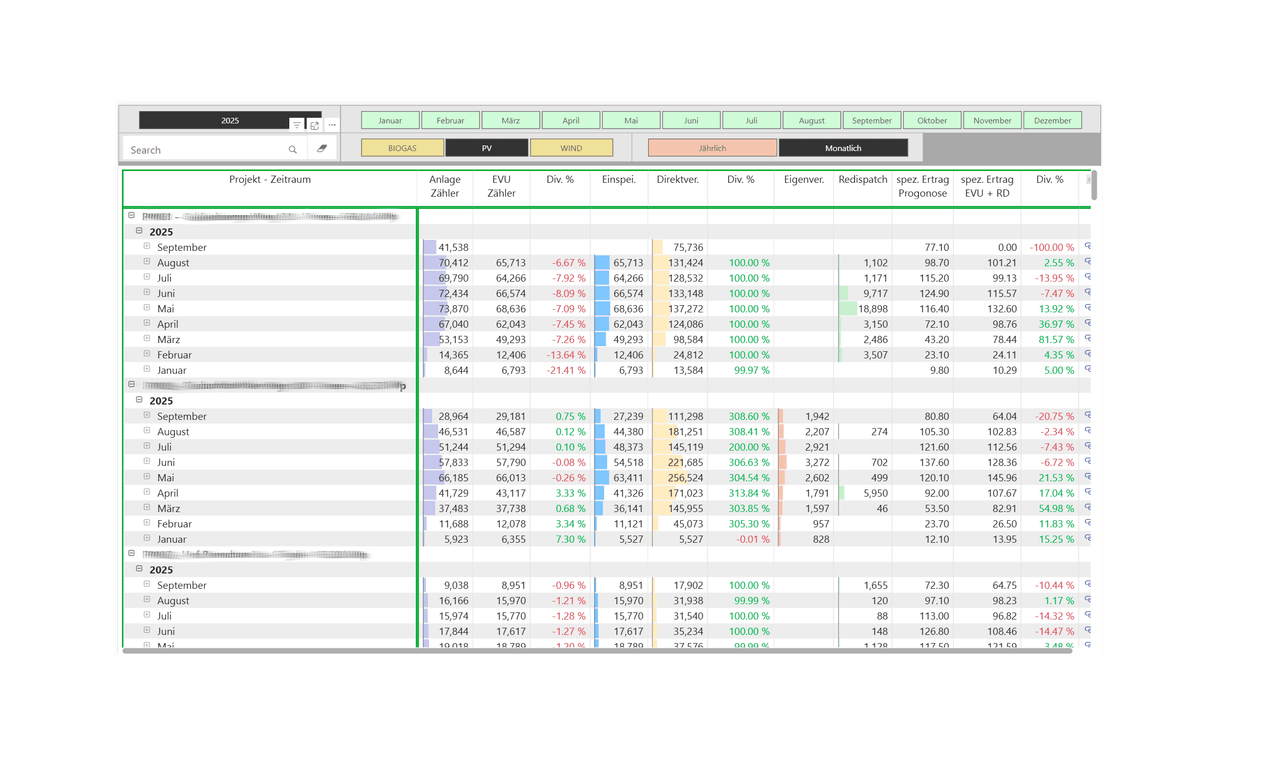 Figure: Technical operations analysis - plant and utility meters compared monthly with color-coded deviations
3. Billing View
The third view bridges operations and cash flow. For each customer and project, it's clear what's billable and what's already invoiced. No item gets left behind, no follow-up is lost, no duplicate billing occurs.
The immediate effects: better liquidity and lower DSO - fewer investigations into "forgotten" services, less need for corrections through accidental duplicate invoices.
In short: the three views interlock. The Missing-Document Matrix ensures completeness. The project time series judge data quality and business relevance. The Billing View turns delivered work into predictable cash flow.
Results
The effects are tangible:
Month-end is lighter because the team now works list-driven instead of searching blindly. Missing documents per project and month stand out immediately - rework becomes predictable and focused.
Data quality rises via standardized document numbers, types, and periods. Pre-coding up to DATEV reduces tax-advisor queries and saves time.
Most importantly, the Pareto focus pays off: by standardizing the Top-11 EVUs, half the workload is in hand - roughly 2% of suppliers cover 47-50% of document volume. The rest can be onboarded in controlled waves.
AI simplifies extraction across 500+ suppliers and even more document types - no per-type training needed, which substantially lowers rollout cost.
The system is highly scalable and ready for the rising document flood.
The DATEV pre-accounting in this project shares parallels with our invoice approval workflow with DATEV XML interface, built for a planning office. And the approach of building industry-specific Power Apps as end-to-end solutions is also reflected in our product configurator for the shading industry.
What does this process really cost you?
Calculate with our ROI calculator when automation pays off for you.
Technology Stack
- Microsoft Dataverse - Central database for documents, projects, companies, and document types
- Model-Driven App - Business app for desktop, tablet, and phone with Business Process Flows
- Power Automate - Automated document processing, approvals, DATEV export
- Power BI - Missing-Document Matrix, plant time series, and billing view
- Azure Document Intelligence - AI-powered document extraction
- Azure Blob Storage - Document storage
- REST API - Interface to monitoring systems (incl. AOMS)
- Microsoft Teams - Integration for project spaces and communication
More Use Cases

PV Project Controlling: 281 Projects in One Dashboard
281 PV projects scattered across Excel, DATEV, and email inboxes. How an energy company gained real-time visibility into project profitability, yield, and cash flow with Power BI.

AI Document Processing: From 15% to 100% Capture Rate
1,200 incoming invoices per month, 85% processed manually. How a mid-market trading company achieved 100% digital capture with Azure AI Document Intelligence and Power Platform - while cutting effort by 86%.

From Notepad to PDF in 10 Minutes - a Product Configurator for Sunshade Contractors
A sunshade contractor with 30 employees replaced paper-based quoting with a Power App. On-site configuration, automatic PDF generation, e-signature, and seamless document filing - all in one flow.