
CASE STUDY
2% of Suppliers. 50% of Documents. One Solution.
How an energy company accelerated its monthly closing by 75% with AI-powered document processing and Microsoft Power Platform.
The Problem
The Monthly Close That Never Gets Easier
A project office for renewable energy manages around 280 active PV, wind, and biogas projects. Every month, 600-700 incoming documents arrive - roughly 8,000 documents per year. Out of around 500 suppliers, just 2% (eleven energy utilities) generate about half of all documents.
- Scattered Excel lists - no reliable reconciliation
- Missing target document list per project and month
- Inconsistent document types across utilities
- No reliable business performance analytics
- Back-and-forth approval cycles with the tax advisor
The Pareto Insight
The Pareto Insight: 2% Suppliers, 50% Effort
Only eleven energy utilities cause half of all documents. And exactly these documents contain the critical information about plant profitability: kWh tables, redispatch lines, direct marketing statements. Manual extraction, evaluation, and cost-center allocation was simply no longer feasible.
The Project in Numbers
Want results like these? 30-minute strategy call - we'll show you where your biggest levers are.
The Solution
From Inbox to DATEV Handover - in One Flow
- 1Automated
Document Intake
Documents from email, portals, or postal mail land in one central import folder. One digital inbox for all channels.
EmailOutlook · IMAPPortalUtility downloadsPostal mailScan · photoOther sourcesCentral import folderOne inbox. All formats.
- 2AI Document Intelligence
AI Extraction
Azure AI Document Intelligence automatically extracts invoice data, master data such as MaStR ID and market location, and usage data. The eleven most important utility suppliers are trained.
500+ suppliersAI extractionPareto suppliers trained
Invoice dataGross · Net · NumberMaster dataMaStR · Market locationUsage datakWh · PeriodsPareto focus: 11 utilities trained = 50% of all documents covered
- 3Dataverse
Categorization
Every document is automatically assigned to five dimensions: supplier, document type, customer, project, and plant. Instead of scattered Excel sheets, a single data source emerges.
DocumentextractedSupplierDocument typeCustomerProjectPlantSingle Source of TruthDataverse - 4Power Automate
Validation & Approval
Business rules check automatically: right project? Right plant? Correct document type? Only edge cases need human review.
DocumentcategorizedValidation- · Project correct?
- · Plant correct?
- · Document type?
Approval- · Automatic
- · Manual on edge cases
Approved - 5DATEV + Gonto
DATEV Export & Payment
Approved documents take two automated paths: via DATEV-XML to the tax advisor - and through Gonto straight into payment. Cash moves, monthly closing gets calmer.
Approvedpre-coded
DATEV-XMLto tax advisor
GontoAccount charged · fast
- 6Power BI
Target/Actual Reconciliation
Missing documents are detected monthly, gaps per project and month are immediately visible. No more silent failures.
Analysis 1 · Target/Actual Document CoverageDocuments per customer × project × document type and monthThe foundation. A single missing utility document hides half the truth for that month - and every downstream analysis becomes patchy. Analysis 2 (yield comparison) depends directly on this: no complete documents, no reliable kWh and yield numbers.
Customer 2026-01 2026-02 2026-03 2026-04 2026-05 2026-06 Total Customer A Project 1 Direct marketing · · · 1 1 · −2 Generation · · · · 1 · −1 Project 2 Direct marketing · · · · · · 0 Generation · 1 · · · · −1 Customer B Project 3 Direct marketing · · 1 · · · −1 Generation · · 1 · · · −1 Empty cell = target met1Red number = count of missing documentsAnalysis 2 · Yield ComparisonPlant meter vs. utility vs. forecast - per plant and monthThis is where it gets interesting: On one side the kWh data directly from the plants (PV, wind, biogas), on the other the statements from the utility. Do the volumes match? The same comparison runs for feed-in, direct marketing, and redispatch - data quality at a glance, plus a real target/actual check for yields.
Customer / Plant Plant meter Utility meter Div. % Spec. yield Forecast Div. % Customer A Plant-001 · 283 kWp January 2.594 2.588 −0.22 % 9,13 12,80 −28.67 % February 5.128 5.108 −0.38 % 24,15 23,20 +4.01 % March 21.145 20.999 −0.69 % 74,05 48,80 +51.74 % Customer B Plant-002 · 99 kWp January 671 674 +0.39 % 6,83 10,20 −33.04 % February 1.616 1.621 +0.33 % 16,42 20,10 −18.31 % March 5.290 5.290 +0.01 % 53,57 45,50 +17.74 % Bar = relative magnitude within column+−Green = within target · Red = larger deviation
The Result
Calculation Example
700 docs/month × 12 min × €1/min = €8,400/month manual cost
After automation: 9 min/doc saved × 700 docs = €6,300/month in savings
What would this calculation look like for your setup? Let's talk for 30 minutes.
“You have to realize that every document landing in the inbox costs money.”
Technology
This Solution Fits Your Business Too
The approach is industry-agnostic - wherever structured document processing and project-based document control are needed.
Renewable Energy Project Developers
PV, wind, biogas, hydro - project-based document management with kWh tracking.
Energy Utilities
Utility document management, billing, and direct marketing in one system.
Project & Engineering Offices
Document and invoice management with target/actual reconciliation per project.
Companies with High Document Volume
Industry-agnostic from 200+ documents per month - wherever manual processing breaks down.
Best part: time tracking, inventory management, contract management and more can be added seamlessly - no extra systems needed, all within the Microsoft ecosystem.
Sounds like you? Let's get specific - free strategy call.
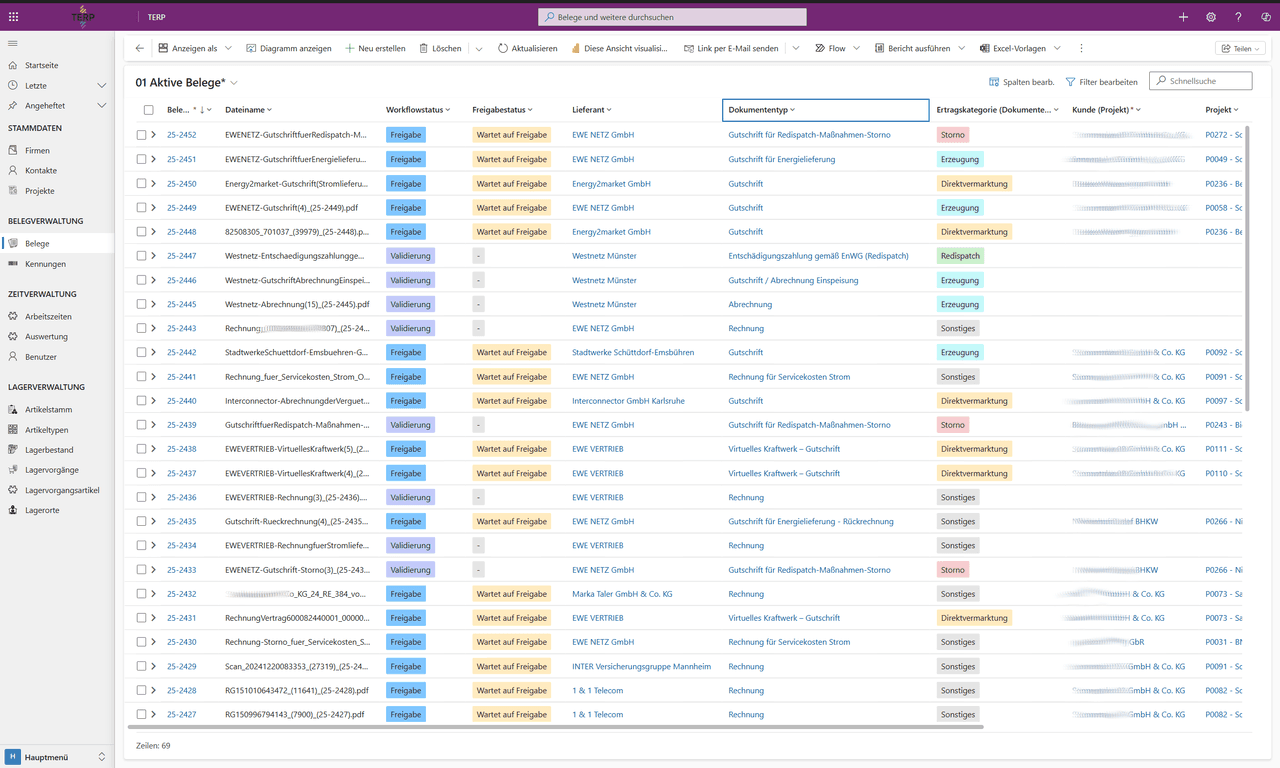
From the application
Real screenshots from the system
Anonymized glimpses of the Dataverse app. Click any image for full size.
Take action
Your Monthly Close Could Look Like This Too
30 minutes, no obligation - let's discuss where your biggest levers are.